Report
The Report page provides a comprehensive analysis of your home’s energy data, supporting four time dimensions: Day, Week, Month, and Year. You can switch between dimensions via the tabs at the top and adjust the time period. The page will dynamically display data for the selected period.
1. Data Indicators
1.1 Daily Data
| Parameter | Description |
|---|---|
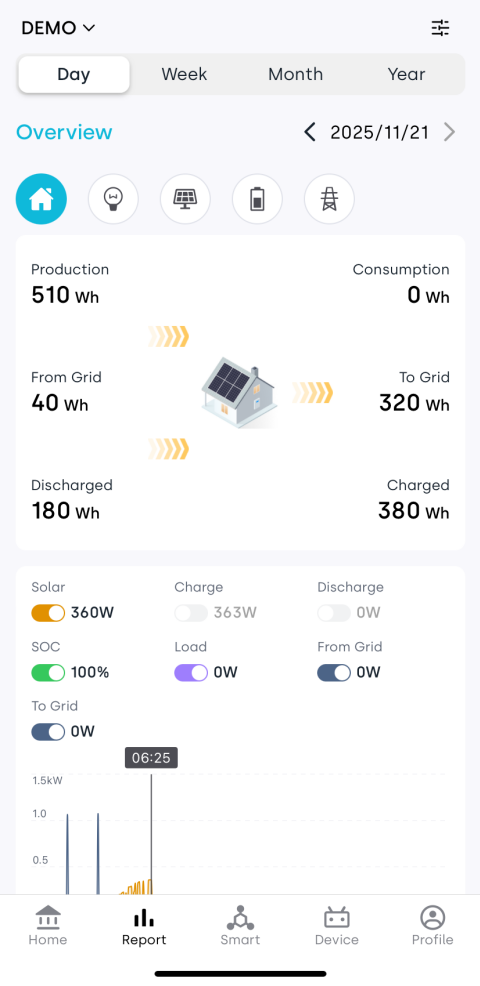
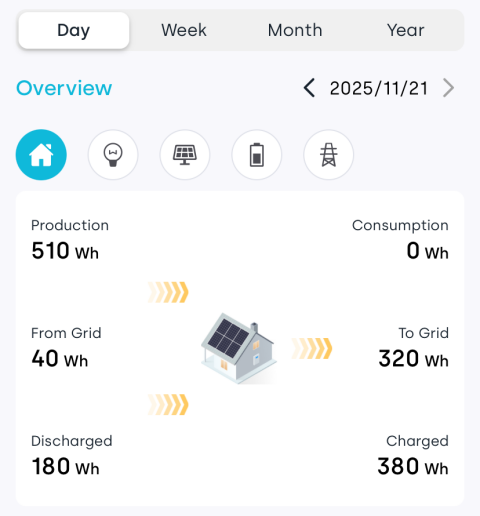
| Production | Total PV energy produced during the selected time period. |
| Consumption | Total household electricity consumption within the selected period, including energy from PV, battery, and the grid. |
| From Grid | Total electricity purchased from the public grid. |
| To Grid | Total electricity fed into the public grid. |
| Discharged | Total energy released by the battery storage system during the period. |
| Charged | Total energy stored by the battery system during the period. |
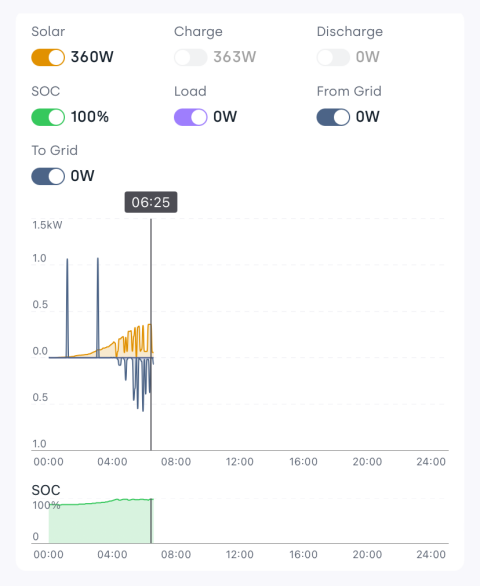
| Solar | Real-time PV output power at the selected point on the chart. |
| Charge | Real-time battery charging power at the selected point on the chart. |
| Discharge | Real-time battery discharging power at the selected point on the chart. |
| SOC | Battery State of Charge (%) at the selected time point. |
| Load | Real-time total power consumed by all household appliances at the selected point. |
| From Grid | Real-time power drawn from the public grid at the selected time point. |
| To Grid | Real-time power fed into the public grid at the selected time point. |
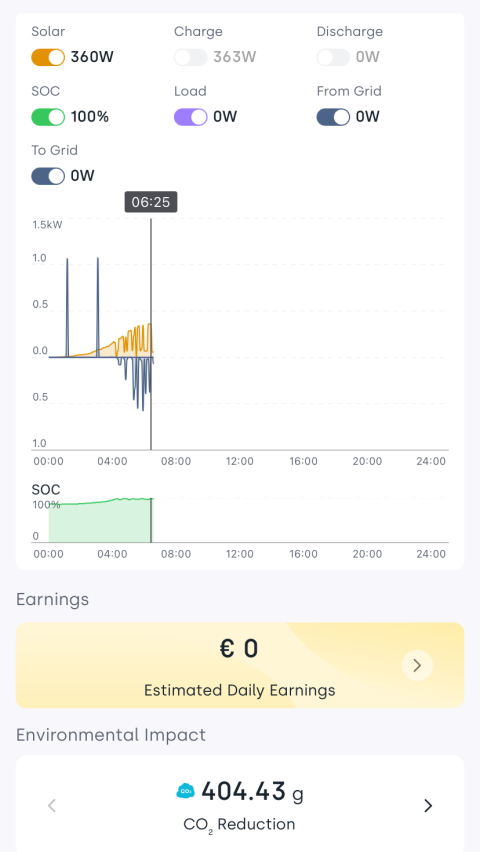
| Earnings | Estimated revenue based on the applicable electricity tariff. See formulas below. |
| Environmental Impact | Displays metrics such as total carbon reduction, equivalent tree planting, and coal savings. |
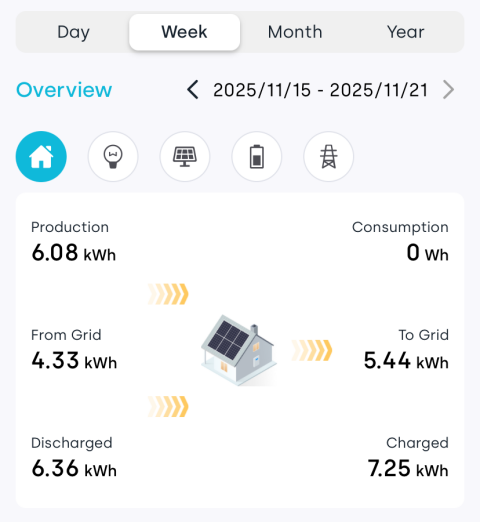
1.2 Weekly / Monthly / Yearly Data
| Parameter | Description |
|---|---|
| Production | Total PV energy produced during the selected time period. |
| Consumption | Total household electricity consumption within the selected period, including energy from PV, battery, and the grid. |
| From Grid | Total electricity purchased from the public grid. |
| To Grid | Total electricity fed into the public grid. |
| Discharged | Total energy released by the battery storage system during the period. |
| Charged | Total energy stored by the battery system during the period. |
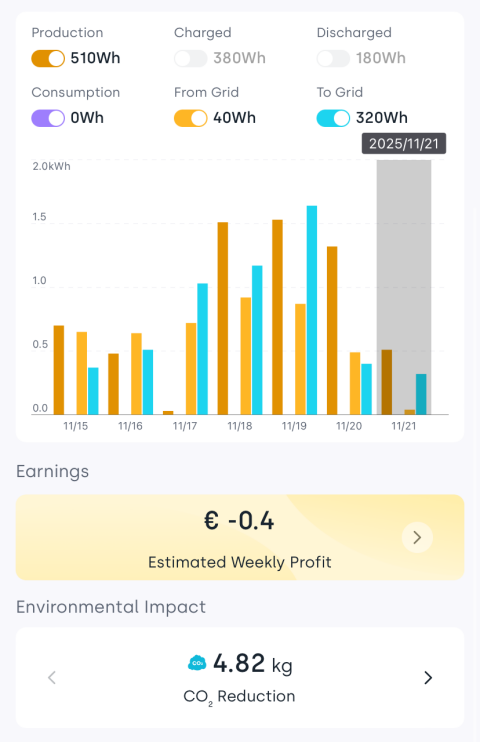
| Production | PV energy produced within the selected custom range on the chart. |
| Charged | Battery energy stored within the selected custom range. |
| Discharged | Battery energy released for household use within the selected custom range. |
| Consumption | Total household electricity consumption within the selected custom range. |
| From Grid | Electricity purchased from the public grid within the selected range. |
| To Grid | Electricity fed into the grid within the selected range. |
| Earnings | Estimated revenue based on the applicable electricity tariff. See formulas below. |
| Environmental Impact | Displays metrics such as total carbon reduction, equivalent tree planting, and coal savings. |
Displayed parameters may vary depending on the devices connected to each home. Please refer to your actual interface.
1.3 Earnings
Earnings consist of two parts: self-consumption savings and sales earnings, calculated based on the tariff plan configured for your home.
-
Self-consumption savings = Saved Energy × Purchase Price
Saved energy is calculated using one of the following methods depending on available data:
- When both consumption and grid import data are available:
Saved Energy = Total Consumption − Grid Import - When the above data is not available:
Saved Energy = Generation + Battery Discharge − Battery Charge
- When both consumption and grid import data are available:
-
Sales earnings = Exported Energy × Selling Price
If there is no export behavior, export earnings are zero. - Total Earnings = Self-consumption savings + Sales earnings
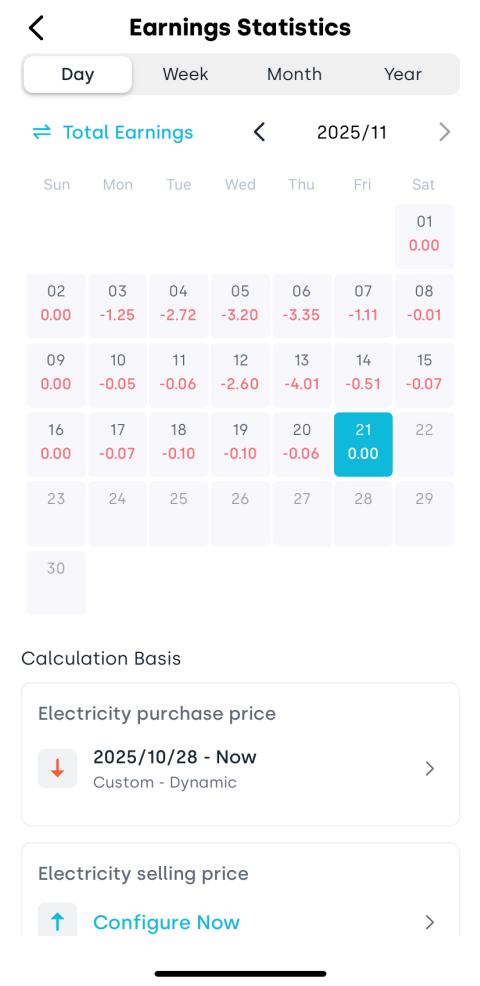
You can tap the Earnings section to open the Earnings Statistics page, where you can:
- View earnings by day, week, month, or year.
- Switch between Total Earnings and Sales Earnings.
- View the tariff plan used for calculations and tap to modify it.
2. Features
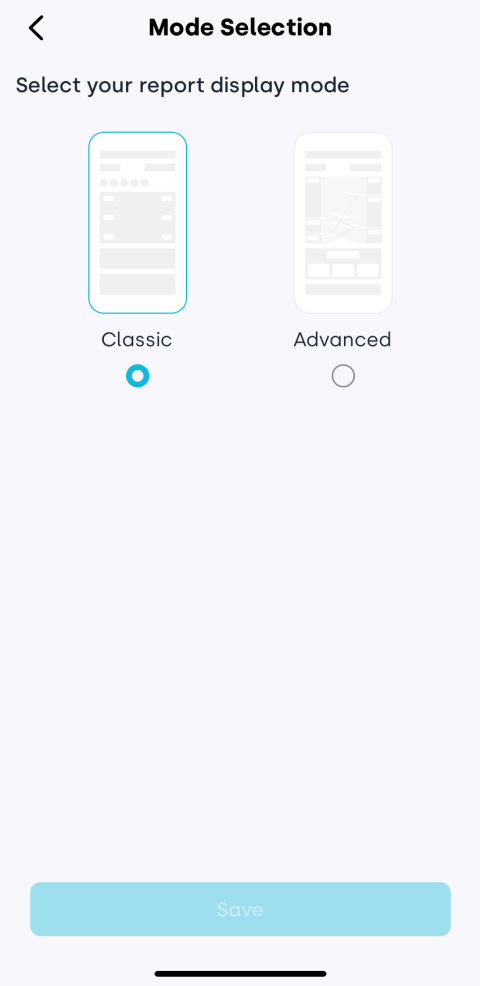
2.1 Advanced Mode
Tap the ![]() icon in the upper-right corner to switch to Advanced Mode, which provides a more intuitive visualization of energy flows.
icon in the upper-right corner to switch to Advanced Mode, which provides a more intuitive visualization of energy flows.
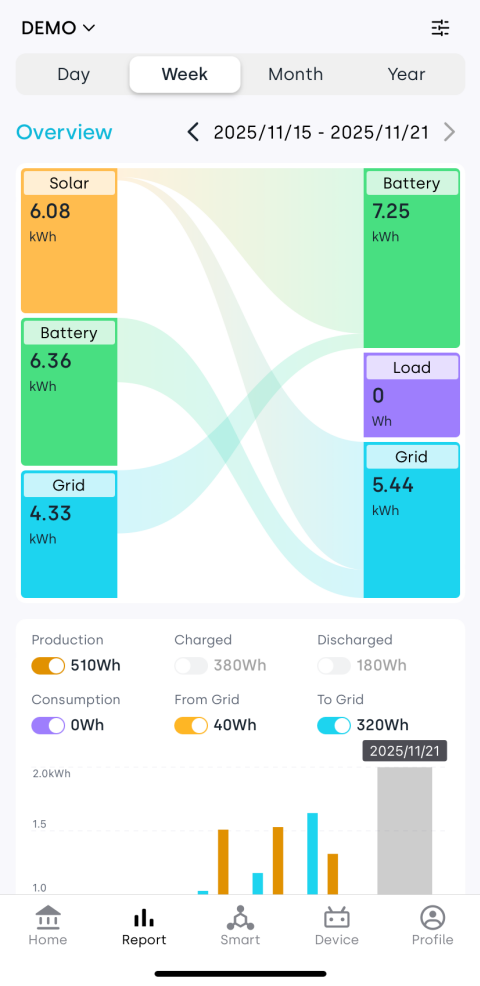
2.2 Data Views
Each time dimension provides an Overview along with detailed views for Consumption, PV, Battery, and Grid. Tap the corresponding icons to switch between data views.

2.3 Chart Display Control
Above the chart area, tap any indicator button to show or hide the corresponding data line. This helps you focus on specific metrics for clearer analysis.